Conducting Hypothesis Testing on Population Means and Proportions
In this section, we will bring together all the components introduced earlier to conduct hypothesis testing. Using sample data, we will determine whether there is sufficient evidence to support or refute a claim about a population mean or proportion.
Using GeoGebra for Hypothesis Testing
As a reminder, we will use the GeoGebra applet for conducting hypothesis tests. This tool allows us to input sample data, specify null and alternative hypotheses, and calculate p-values.
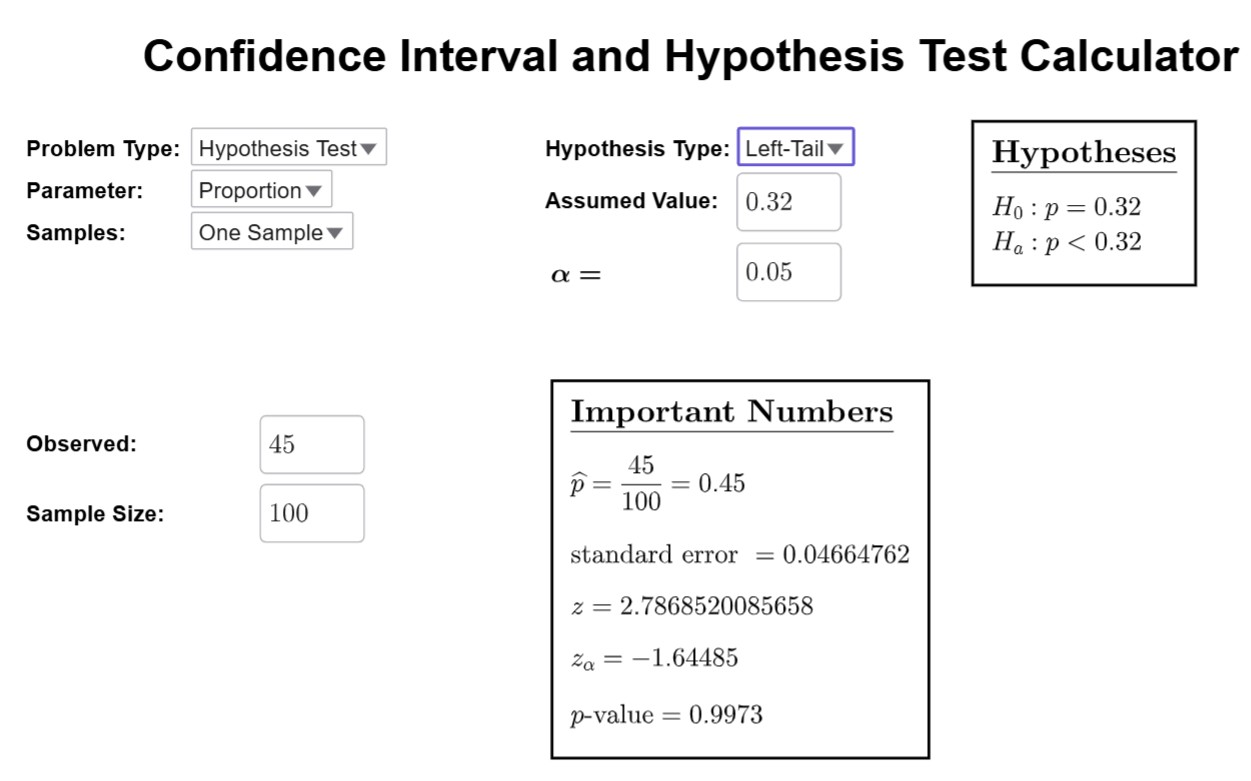
Interactive calculator for confidence intervals and hypothesis testing.
Opens the calculator in a new tab.
Testing Claims about Population Proportions
Example : Smoking Cessation with Nicotine Patch
A study examines whether nicotine patch therapy helps smokers quit. Among 71 smokers, 39 were still smoking one year after treatment, and 32 were not. Use a significance level of \( \alpha = 0.05 \) to test the claim that the majority (\( p > 0.5 \)) of smokers continue smoking after one year.
Solution
Using GeoGebra, input the sample information (\( x = 39, n = 71, p_0 = 0.5 \), and alternative hypothesis \( p > 0.5 \)). The p-value is calculated to be \( 0.0403 \).
Since \( p = 0.0403 < \alpha=0.05 \), we reject the null hypothesis and conclude that there is sufficient evidence to support the claim that the majority of smokers continue smoking after one year.
Example : M&M Colors
Use the dataset below to test the claim of Mars, Inc., that exactly 16% of M&Ms are green. Conduct the hypothesis test at a significance level of \( \alpha = 0.05 \).
The dataset is omitted here for brevity but can be generated dynamically. Download the dataset or use the button below to view it:
This button loads the M&M color dataset in a scrollable table on this page.
Download M&M DataTesting Claims about Population Means
Example : Smartphone Data Speeds
A sample of data speeds from a smartphone carrier at airports results in a mean of 3.8 Mbps. Test the claim that the population mean is less than 4.0 Mbps using a significance level of \( \alpha = 0.05 \).
Solution
Input the sample mean (\( \bar{x} = 3.8 \)), standard deviation (\( s = 0.5 \)), and sample size (\( n = 25 \)) into GeoGebra. The p-value is calculated to be \( 0.0231 \).
Since \( p = 0.0231 < \alpha=0.05 \), we reject the null hypothesis and conclude that there is evidence to support the claim that the mean data speed is less than 4.0 Mbps.
Example : Years to Earn a Bachelor's Degree
Listed below are the years it took a random sample of students to earn a bachelor's degree. Use a significance level of \( \alpha = 0.01 \) to test the claim that the mean time to earn a bachelor's degree is greater than 4.0 years.
| Years |
|---|
| 4 |
| 4 |
| 4 |
| 4 |
| 4 |
| 4.5 |
| 4.5 |
| 4.5 |
| 4.5 |
| 4.5 |
| 6 |
| 6 |
| 8 |
| 9 |
| 9 |
| 13 |
| 13 |
| 15 |
Solution
Input the sample data into GeoGebra and test the claim using \( \bar{x} = 6.28 \) (sample mean), \( s = 3.21 \) (sample standard deviation), and \( n = 18 \) (sample size). The null hypothesis is \( H_0: \mu = 4.0 \), and the alternative hypothesis is \( H_a: \mu > 4.0 \).
The p-value is calculated to be \( 0.0054 \).
Since \( p = 0.0054 < \alpha=0.01 \), we reject the null hypothesis and conclude that there is sufficient evidence to support the claim that the mean time to earn a bachelor's degree is greater than 4.0 years.
Example : Speed of Traffic on I-280
A random sample of southbound traffic speeds on I-280 near Cupertino, California, was recorded at 3:30 PM on a weekday. Use the data provided to test the claim that the mean speed of travelers is less than the speed limit of 65 mph. Conduct the test using a significance level of \( \alpha = 0.05 \).
| Speed (mph) |
|---|
| 62 |
| 61 |
| 61 |
| 57 |
| 61 |
| 54 |
| 59 |
| 58 |
| 59 |
| 69 |
| 60 |
| 67 |
Solution
Using GeoGebra, input the sample mean (\( \bar{x} = 60.17 \)), standard deviation (\( s = 4.32 \)), and sample size (\( n = 12 \)). The null hypothesis is \( H_0: \mu = 65 \), and the alternative hypothesis is \( H_a: \mu < 65 \).
The p-value is calculated to be \( 0.0008 \).
Since \( p = 0.0008 < \alpha=0.05 \), we reject the null hypothesis and conclude that there is sufficient evidence to support the claim that the mean speed of traffic is less than the speed limit of 65 mph.